Finding Packet Drop Location
on Blog
Sometimes we made a query, which is basically a network pack, and these queries do not have a response.
A few days ago, I built a latency measurement tool which is uping. Many tools are available on the internet but this tool is slightly different than others. It calculates the time spent on outgoing and incoming and shows us.
For test purposes, I made several tests with different configurations on this program.
While at the test stage, sometimes packets have no response. In this blog, we are not looking for the reason behind packet loss, we are trying to figure out where the packet is lost or dropped.
Such a case, in the first step on the client-side we can run traceroute command to try to figure out if anyone drops the packet. On the other hand, we can inspect the server traffic to determine if the packet arrives at the server. Let’s look at the results.
Client to Server
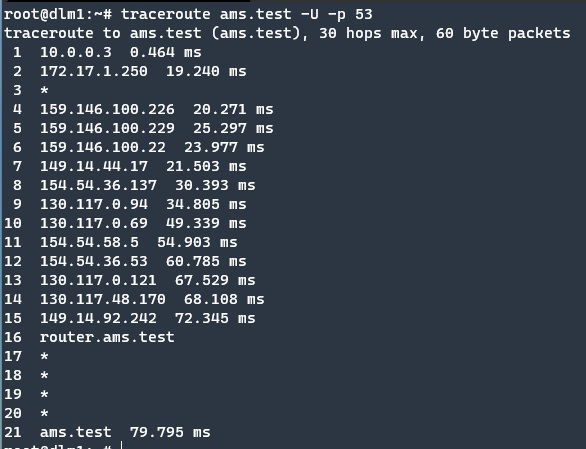
The traceroute command, which is used to look at the path between server and client, does not show any problem at that time. This means port 53 is not closed. Traceroute test packets are not dropped but may be, Uping packets dropped somewhere else.
Starting to Packet Inspection
To test this idea, we are running one of my favourite tools, the tcpdump on the second stage for traffic inspection.
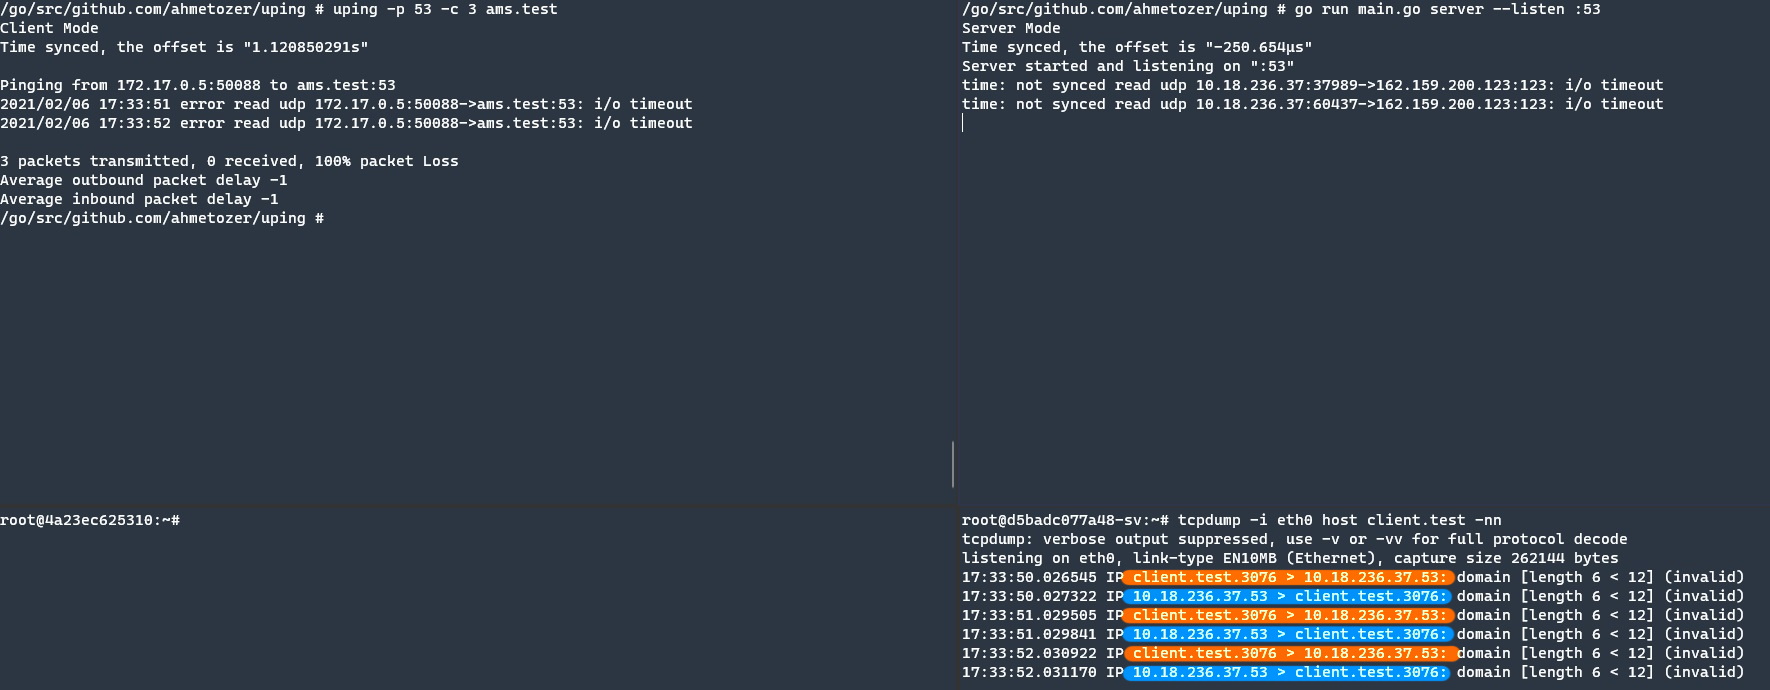
Tcpdump shows that packets arrive at the server and the server has a response for each query. The responses are highlighted with colours. Orange marks are for incoming requests from the client to the server. Blue ones are server responses.
In line with these results, it becomes clear that custom packets arrive at the server, queries processed on the server and responded to the client, but these custom packets have not arrived at the client.
Server to Client
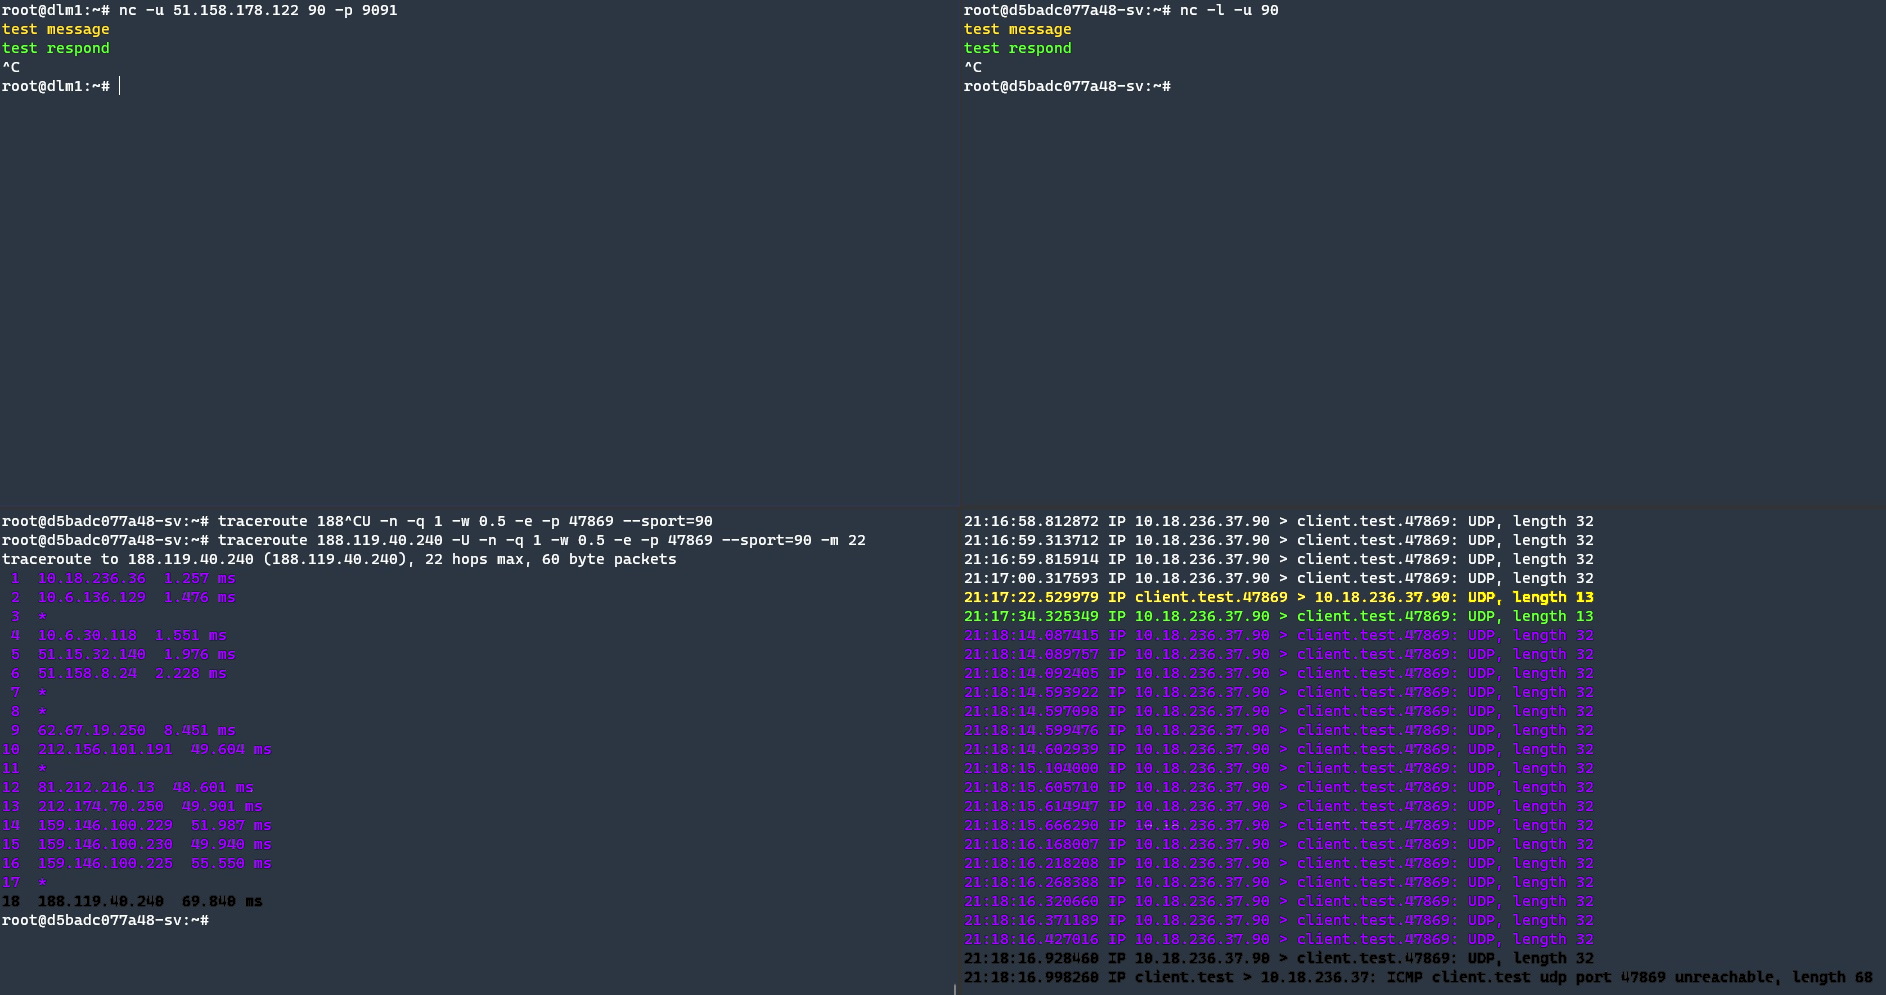
To better understand the situation, I execute traceroute command from server-side to client-side to determine the network path. Before the execution, I use Netcat to find the client port.
The yellow colour indicates (text and packets) are sent from client-side, green colour is responded packet. The Inspection tool shows that the client port is 47869. After determining the client port, we can close the Netcat on client-side and server-side. Otherwise, if don’t close on server-side, traceroute cannot bind the same UDP port, and also if we forgot the closing Netcat on the client, by default Netcat does not have responded, so traceroute can’t get a response.
Purple coloured texts are traceroute packets, Black coloured is responded by the client-side. With these results, we had an 18 hop server to the client and we know the default path.
17th hop is not the mysterious device, it is my home router, you can see previous traceroute executions.
Finding Packet Drop Location
Now that we know the correct route, we can examine the problematic route now. 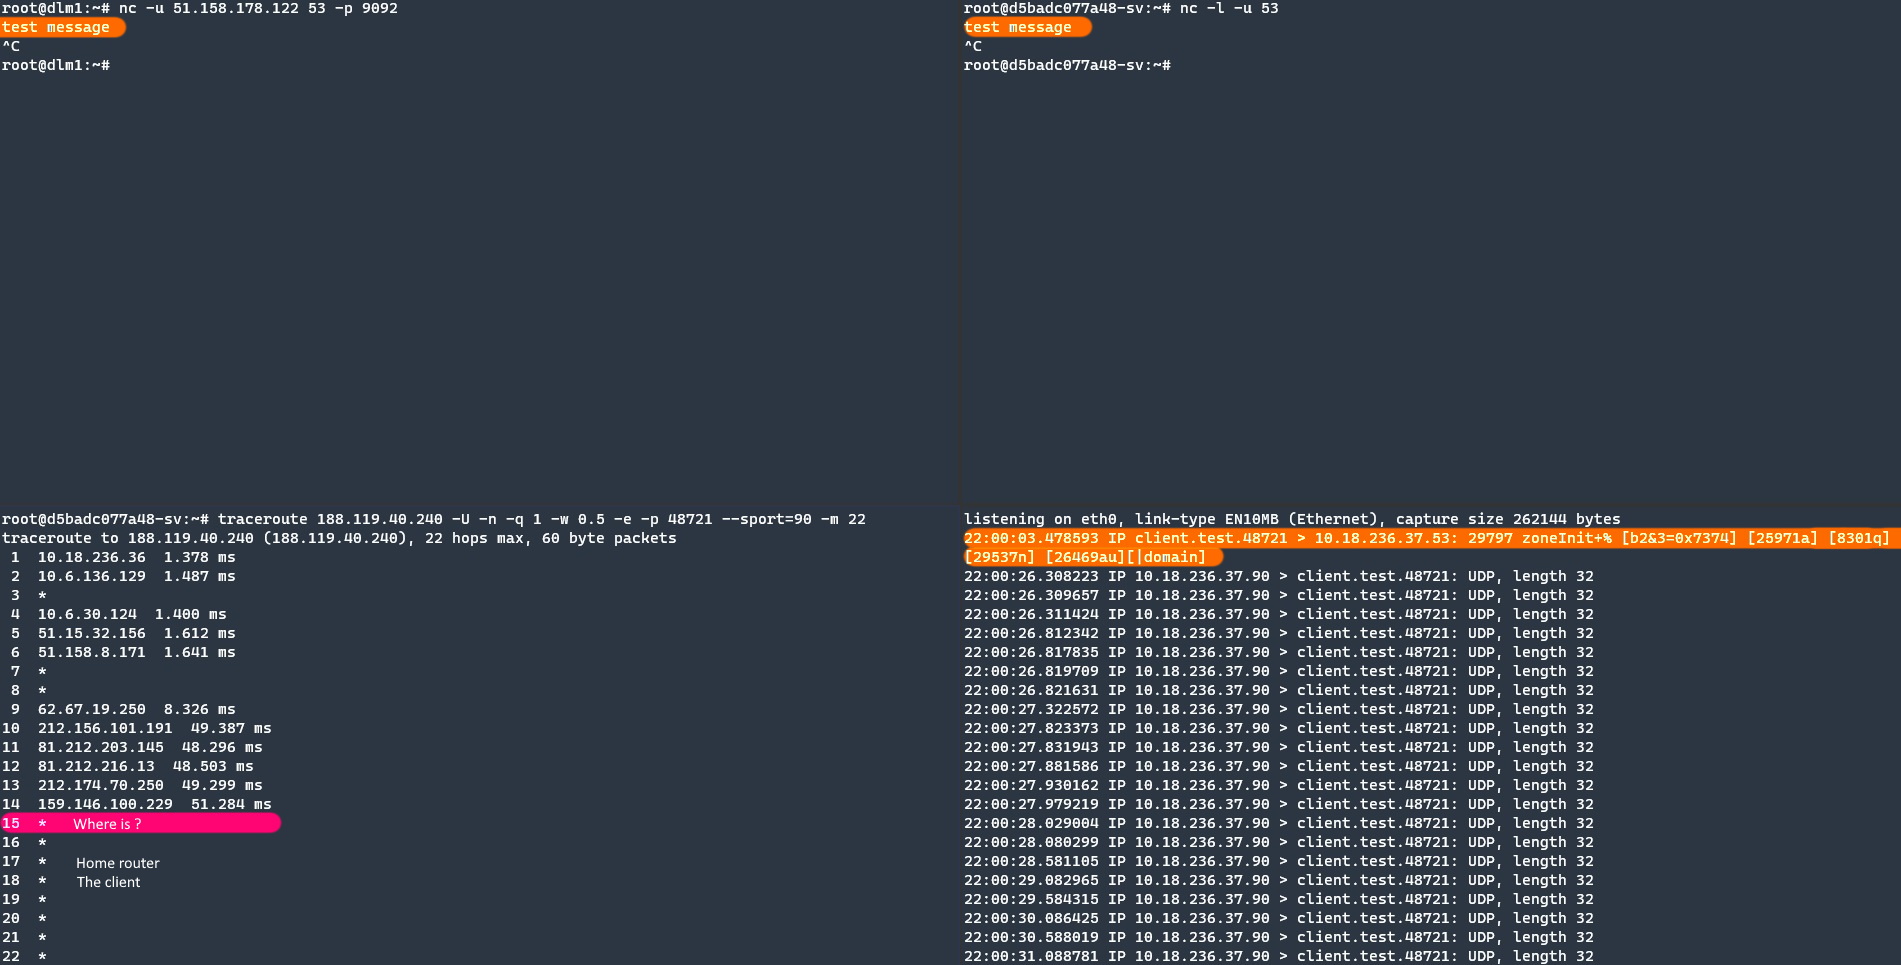
Again the orange highlight is client “test message” packets. In the previous result, the client was located at 18. hop. If there is no complex system or a different system than we expected, there is a high probability that the package dropped at 15th hop.
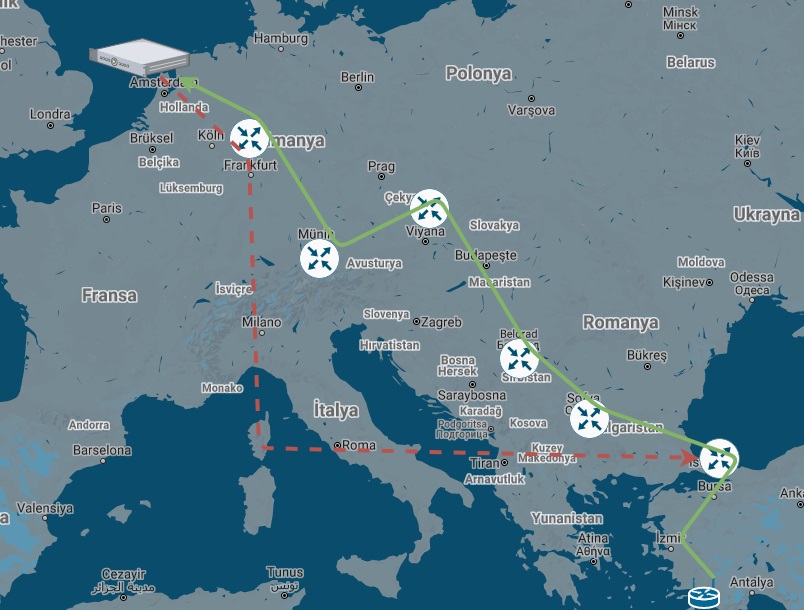
The network path of my client to server connection.
        > Istanbul (Gayrettepe Turknet) > Sofia (Cogent) > Belgrade (Cogent) > Vienna (Cogent) > Munich (Cogent) > Frankfurt (Cogent) > Amsterdam (Cogent) >
client                                                                                                                                                        Server
        < Istanbul (Gayrettepe Turknet) < Istanbul (Acibadem TurkTelekom)                       < Frankfurt (TurkTelekom) < Level3 (Frankfurt) < Amsterdam <
But WHY?
Port 53 is used for DNS and Port 53 is a sweet port for non protected servers to use as reflection attacks. 15th or 16th hop is my Service provider and they might apply a white list for port 53.
Let’s control this idea.
I temporally run socat for forwarding Port 53 is to common Public DNS server on the server-side.
docker run -it --rm --network host ahmetozer/cna socat UDP4-RECVFROM:53,fork UDP4-SENDTO:1.1.1.1:53
On the client side, I execute nslookup for testing.
$ nslookup example.com server
Server:         research1.sv.local
Address:        research1.sv.local#53

Non-authoritative answer:
Name:   google.com
Address: 216.58.214.14
Name:   google.com
Address: 2a00:1450:400e:804::200e

So what happened my other packets?
If the port sensitive for data it means very great firewall between me and server (15th hop) to check is it real DNS question or all packets forwarded to some proxy.
It is another post and I will write in this week.
I hope you liked this blog. If so don’t forget to share, stay safe and see you in the next blog.